
Core Web Vitals turn website performance into three user-focused measurements: how quickly the main content appears, how promptly a page responds to interaction, and how visually stable the layout remains. They matter because a page can look fast to its owner while still feeling slow, unresponsive, or jumpy to real visitors.
This guide explains what each metric measures, the thresholds that define a good experience, how field and laboratory data differ, and how to diagnose and improve problems without chasing a meaningless perfect score.
Quick Answer: What Are Core Web Vitals?
Core Web Vitals are Google’s standardized metrics for loading performance, responsiveness, and visual stability. The current metrics are Largest Contentful Paint (LCP), Interaction to Next Paint (INP), and Cumulative Layout Shift (CLS). A page passes when all three meet their “Good” thresholds at the 75th percentile of real visits, evaluated separately for mobile and desktop.
A good result supports a better user experience and can contribute to search performance, but it does not guarantee rankings. The aim is to remove delays and instability that frustrate users, not to optimize a score in isolation.
Key Takeaways
- LCP measures when the page’s main visible content finishes rendering.
- INP measures how quickly the page responds visually after a user interaction.
- CLS measures unexpected movement of visible content.
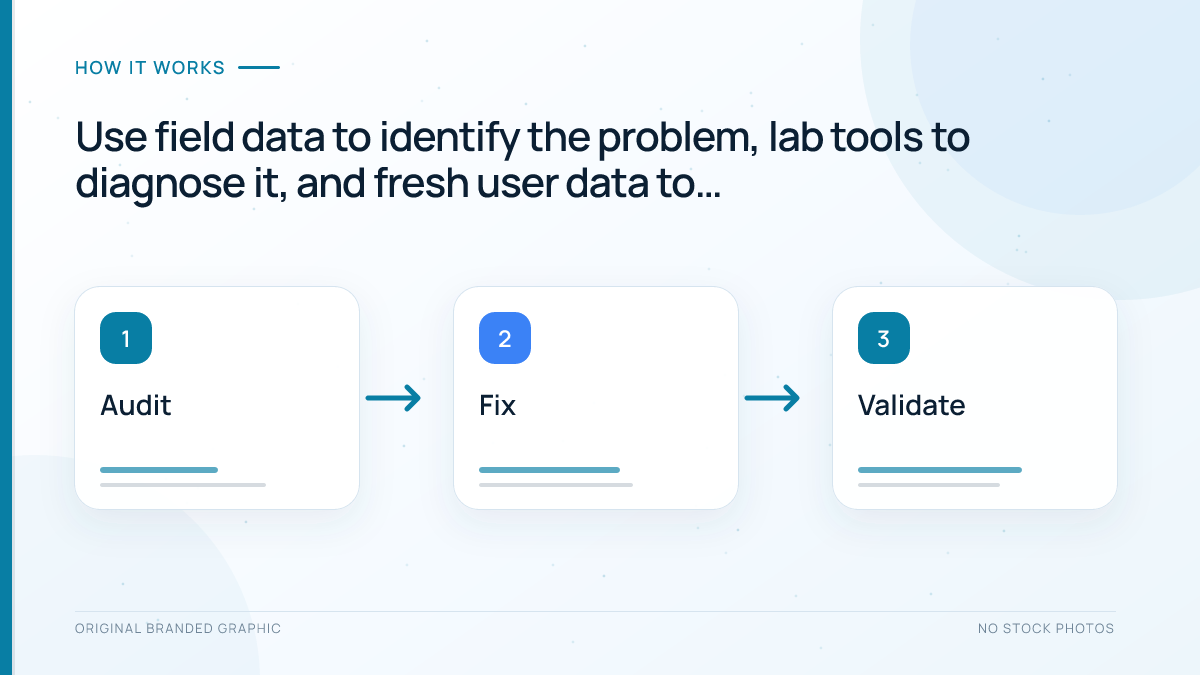
- Real-user field data is the basis for Core Web Vitals assessment; lab tools help diagnose causes.
- A URL must meet the good threshold for all three metrics at the 75th percentile to pass.
- Fix shared templates and root causes before spending time on isolated score changes.
- Core Web Vitals belong inside a broader technical SEO and page-experience strategy.
What Are Core Web Vitals Measuring?
Core Web Vitals are a subset of the wider Web Vitals initiative. According to the official Web Vitals documentation, each metric represents a distinct part of the experience that can be measured in the field. Together, they answer three practical questions: Did the important content load promptly? Did the page respond when the user tried to use it? Did elements stay where the user expected them to remain?
Largest Contentful Paint (LCP): Loading Performance
LCP measures the time from the start of navigation until the largest eligible image, text block, or other main content element visible in the viewport has rendered. On an article page, the LCP element may be the featured image or a large heading. On a product page, it is often the main product image.
A slow LCP does not simply mean “the whole page is slow.” It points to a delay in showing the content that most strongly signals to the visitor that the page is useful. Server response time, render-blocking stylesheets, large hero images, font loading, and client-side rendering can all delay it.
Interaction to Next Paint (INP): Responsiveness
INP observes interactions such as clicks, taps, and keyboard input during a visit. It reports a value that represents the page’s overall interaction responsiveness, with unusual outliers handled by the metric. In plain language, INP asks how long users typically wait before the interface provides visible feedback after they act.
A page can achieve a fast LCP and still have poor INP. For example, an article may appear quickly but ignore a tap on its menu because the browser is busy running a long JavaScript task. Heavy scripts, excessive event-handler work, complex rendering, and a crowded main thread are common causes.
Cumulative Layout Shift (CLS): Visual Stability
CLS measures unexpected layout shifts during the life of a page. A shift happens when a visible element moves from one rendered position to another without the user causing the movement. The classic example is a visitor preparing to tap a link just as an advertisement, image, or banner loads above it and pushes the link downward.
CLS is a score rather than a time value. Missing image dimensions, dynamically inserted content, late-loading fonts, and animations that change layout properties can produce instability. Expected movement after a deliberate user action is generally treated differently from an unexpected shift.
What Are the Good Core Web Vitals Thresholds?
Google recommends assessing each metric at the 75th percentile of page loads. That means at least 75% of measured visits should meet the relevant target. The current thresholds are:
| Metric | Good | Needs Improvement | Poor |
|---|---|---|---|
| Largest Contentful Paint (LCP) | 2.5 seconds or less | More than 2.5 seconds and up to 4 seconds | More than 4 seconds |
| Interaction to Next Paint (INP) | 200 milliseconds or less | More than 200 milliseconds and up to 500 milliseconds | More than 500 milliseconds |
| Cumulative Layout Shift (CLS) | 0.1 or less | More than 0.1 and up to 0.25 | More than 0.25 |
The page passes only when LCP, INP, and CLS are all rated Good. An excellent LCP cannot compensate for a poor CLS. Mobile and desktop are also assessed separately, so a URL can pass on one device type and fail on the other.
Why Do Core Web Vitals Matter for SEO?
Core Web Vitals matter first because they describe problems that visitors genuinely notice. Slow main content creates uncertainty. Delayed interactions make controls feel broken. Layout shifts cause mistakes and erode trust. Improving these experiences can support engagement, usability, and conversions even before any search effect is considered.
Google states that Core Web Vitals are used by its ranking systems, but it also makes clear that there is no single page-experience signal and that good scores do not guarantee top rankings. Search still aims to return the most relevant and helpful result. Treat performance as one part of a complete page experience, alongside useful content, mobile usability, security, accessible design, and non-intrusive interfaces.
This distinction prevents a common strategic mistake: delaying meaningful content improvements to pursue a score of 100. If a page already passes comfortably, the next hour may be better spent improving the answer, structure, or internal links. If the page is Poor and visitors struggle to use it, performance deserves urgent attention.
How Are Core Web Vitals Measured?
Core Web Vitals can appear in both field tools and lab tools, but those sources answer different questions. Understanding the distinction is essential because a single lab test can disagree with the real-user assessment without either result being wrong.
Field Data Shows What Real Users Experienced
Field data is collected from eligible real-world Chrome visits and aggregated in the Chrome User Experience Report, commonly called CrUX. It includes the variety that websites face in practice: fast and slow devices, different network connections, varied locations, cold and warm caches, and different patterns of interaction.
Google Search Console’s Core Web Vitals report uses field data. It groups similar URLs and labels them Good, Needs Improvement, or Poor. Low-traffic pages may not have enough data to appear individually, and a new site may show no data at all. No data does not automatically mean that the page passes or fails.
Lab Data Helps Reproduce and Diagnose Problems
Lab data comes from a controlled test with a simulated device and network. PageSpeed Insights displays lab diagnostics from Lighthouse alongside field data when field data is available. Chrome DevTools can provide deeper evidence such as network timing, main-thread work, layout shifts, and the element identified as the LCP candidate.
Lab tests are useful before launch and after each change because they provide immediate feedback. They are less suitable as the final verdict because one simulated load cannot represent every real visitor. INP also depends on actual interactions across a visit; lab tools commonly use diagnostic proxies and controlled interactions to investigate responsiveness.
Why the 75th Percentile Matters
An average can hide a poor experience for a meaningful share of visitors. The 75th percentile asks whether the large majority of visits meet the target. If an LCP value at the 75th percentile is 3.2 seconds, roughly three quarters of measured loads were at or below 3.2 seconds and the page remains in the Needs Improvement range.
The practical lesson is to test beyond a fast office connection and a high-end phone. Performance work should protect people using ordinary devices and less reliable networks, not only the easiest testing conditions.
How to Test Core Web Vitals Step by Step
- Start with Search Console. Open the Core Web Vitals report and review mobile and desktop separately. Identify Poor URL groups first, then Needs Improvement groups. Remember that one example URL may represent many pages with the same template or issue.
- Test a representative URL in PageSpeed Insights. Check whether real-user data is available, note the failing metric, and then review the lab diagnostics for likely causes. Do not assume every opportunity listed has equal impact.
- Reproduce the issue in Chrome DevTools. Inspect the LCP element, long tasks, layout-shift sources, request waterfall, and third-party scripts. Test while logged out and with a clean cache so administrative sessions do not distort the experience.
- Compare URLs that share a template. If every article has poor LCP, the theme, hero image treatment, font loading, or shared scripts may be responsible. If only one page fails, investigate its unique assets and embeds.
- Record a baseline. Save the metric, device type, tested URL, field status, lab result, and test conditions. Without a baseline, it is difficult to know whether a deployment helped.
- Make one controlled batch of changes. Re-test in the lab immediately, deploy safely, and then monitor field data as real visits accumulate.
For a broader walkthrough of the reports used in this process, see the Google Search Console beginner’s guide. Google’s own Core Web Vitals report documentation also explains URL groups, device reports, and fix validation.
How to Improve Largest Contentful Paint (LCP)
Begin by identifying the actual LCP element. Optimizing unrelated icons or a footer image will not solve a hero image that arrives late. PageSpeed Insights and DevTools can show which element was selected during a test.
Reduce Server and Document Delays
- Use suitable hosting and inspect slow backend processing.
- Cache full pages where the site’s functionality allows it.
- Reduce unnecessary redirects before the final HTML document.
- Use a content delivery network when geography creates avoidable latency.
- Keep database work, plugins, and server-side requests under control.
The browser cannot discover most page resources until the initial HTML arrives. A slow server therefore delays images, stylesheets, fonts, and scripts downstream.
Make the LCP Resource Easy to Discover
- Place the important image in the initial HTML instead of injecting it late with JavaScript.
- Do not lazy-load an above-the-fold LCP image.
- Use a preload or high fetch priority selectively when the browser would otherwise discover the resource late.
- Avoid hiding the primary visual inside a large CSS background when a normal image element is more appropriate.
Optimize Images and Render-Blocking Resources
Compress the image, deliver dimensions appropriate for the display, use a modern supported format, and serve responsive variants. The site’s image SEO best practices guide explains how file size, dimensions, formats, and descriptive text fit together.
Remove unused CSS, keep critical styling efficient, and defer nonessential scripts that block rendering. Be careful with automated delay settings: a tool that postpones every script may break menus, consent controls, analytics, or interactive components. Performance changes still require functional testing.
How to Improve Interaction to Next Paint (INP)
INP problems usually mean the browser’s main thread is too busy to process an input, run the necessary code, and paint the next visual state promptly. The solution is not simply “remove JavaScript.” The aim is to reduce unnecessary work and divide essential work into manageable pieces.
Find Long Tasks and Expensive Interactions
- Use the DevTools Performance panel to record a slow interaction.
- Look for long tasks that block the main thread.
- Inspect event handlers that perform too much calculation or trigger repeated layout work.
- Test menus, filters, forms, accordions, search boxes, and consent banners, not just the initial page load.
Reduce Main-Thread Work
- Remove unused JavaScript and load features only on pages that need them.
- Split long tasks so the browser can respond between pieces of work.
- Avoid rendering very large interface updates at once.
- Reduce third-party scripts, tags, and widgets that deliver little user value.
- Provide immediate visual feedback when an action requires longer processing.
Imagine a filter button that starts processing hundreds of items synchronously. The visitor taps it, but nothing changes until the calculation finishes. Breaking up the work or processing only the visible results allows the browser to acknowledge the tap sooner and improves the perceived response.
How to Improve Cumulative Layout Shift (CLS)
CLS fixes are often straightforward once the shifting element is identified. The general rule is to reserve the space an element will need before it loads.
Reserve Space for Images, Videos, Ads, and Embeds
- Set width and height attributes or an appropriate CSS aspect ratio for images and videos.
- Give advertisement and embed containers a stable minimum size.
- Use placeholders when late content has predictable dimensions.
- Avoid inserting banners above content that the visitor is already reading.
Load Fonts Without Surprising Reflow
A fallback font and a web font can occupy different amounts of space, causing headings and paragraphs to move when the final font appears. Preload essential font files when justified, limit unnecessary weights, use an appropriate font-display strategy, and choose a fallback with compatible dimensions.
Animate Without Changing Layout
Prefer transform and opacity animations over changes to properties such as top, left, width, or height when the visual design permits it. Also distinguish unexpected shifts from movement the visitor requested. An accordion expanding immediately after a click is different from a promotional bar appearing without warning.
A Practical Core Web Vitals Optimization Workflow
Effective performance work follows evidence rather than a list of generic tweaks. Use this sequence:
- Classify the problem. Identify the failing metric, device type, and affected URL group.
- Choose representative pages. Test one typical URL, one important conversion or lead page, and one unusually heavy page from the group.
- Find the root cause. Connect the metric to a specific element, request, script, layout shift, or shared template behavior.
- Estimate reach and risk. A theme-level fix may improve hundreds of pages but deserves staging and regression testing. A page-specific image fix has smaller reach and lower risk.
- Implement the smallest reliable change. Avoid stacking many unrelated optimizations into one release.
- Verify immediately in lab tools. Confirm the intended bottleneck changed and check that key functions still work.
- Monitor real-user data. Watch Search Console and, when available, your own real-user monitoring until the field assessment reflects enough new visits.
On WordPress, caching, image delivery, fonts, themes, plugins, and hosting often interact. The guide on how to speed up a WordPress website covers that platform-specific layer. Apply changes in staging when possible, keep a rollback path, and test pages while logged out.
Common Core Web Vitals Mistakes
- Chasing a perfect Lighthouse score. A score is a diagnostic summary, not the business or SEO goal. Fix user-visible bottlenecks and failing field metrics first.
- Confusing lab data with field data. An excellent lab run does not erase a poor 28-day field pattern, and a weak isolated run does not prove every visitor had a bad experience.
- Optimizing the wrong element. Compressing every thumbnail will not repair LCP if the main delay is server response or a late-discovered hero image.
- Testing only the homepage. Articles, product pages, category pages, and tools may use different templates and assets.
- Ignoring mobile performance. Desktop hardware and broadband can hide main-thread and network problems.
- Installing several optimization plugins at once. Overlapping cache, minification, and delay features can conflict, duplicate work, or break the interface.
- Validating too soon. Lab changes are immediate; field reports require new real-user data. Use each source for the job it can perform.
- Treating performance as a one-time project. New scripts, design changes, ads, fonts, and content can introduce regressions after a page passes.
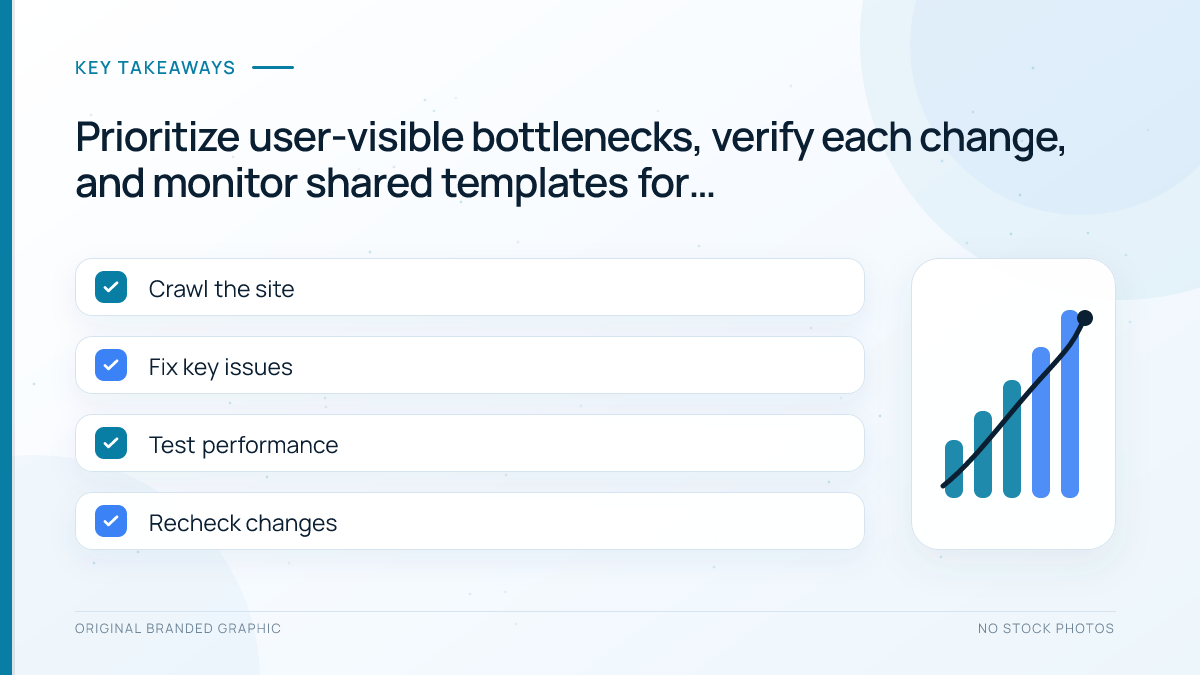
Core Web Vitals Best Practices Checklist
- Measure mobile and desktop separately.
- Use field data for the real-user verdict and lab data for diagnosis.
- Confirm the actual LCP element before changing assets.
- Keep above-the-fold images discoverable and appropriately sized.
- Reduce long JavaScript tasks and unnecessary third-party code.
- Reserve dimensions for images, videos, ads, and embeds.
- Test shared templates as well as high-value individual URLs.
- Record a baseline and change one controlled batch at a time.
- Check navigation, forms, consent tools, and analytics after optimization.
- Monitor regressions whenever the theme, plugins, tags, or content design changes.
- Balance performance work with content quality and the visitor’s actual goal.
Frequently Asked Questions
Do Core Web Vitals directly affect Google rankings?
Core Web Vitals are used by Google’s ranking systems as part of the broader page-experience picture, but they are not a shortcut to higher rankings. Relevance, helpful content, links, and many other signals still matter. Improving a poor experience can help a page compete when several results are similarly useful, while a perfect performance score cannot make an irrelevant or weak page rank.
Why does PageSpeed Insights show different results each time?
The laboratory test runs under simulated conditions, so server response, test location, network variation, third-party scripts, and cache state can change the result. Field data is steadier because it summarizes real visits over time, but it updates more slowly. Compare several lab runs, look for repeated bottlenecks, and use field data to judge the experience users actually receive.
Can a page pass Core Web Vitals on desktop but fail on mobile?
Yes. Mobile and desktop data are evaluated separately because devices, screen sizes, processors, and network conditions differ. A page may load quickly on a powerful desktop but struggle on a mid-range phone over a slower connection. Test both device types, but give special attention to the environment used by most of your audience and to any device category marked Poor in Search Console.
How long does Search Console take to show a Core Web Vitals fix?
A lab test can reflect a deployed fix immediately, but Search Console relies on aggregated real-user data and therefore changes more slowly. Its validation process monitors the affected URL group over a multi-week period, commonly up to 28 days. Use PageSpeed Insights or DevTools to confirm the technical change first, then watch field data as enough new visits accumulate.
Should I remove WordPress plugins to improve Core Web Vitals?
Do not remove plugins simply because they exist. Identify which plugins add render-blocking files, long JavaScript tasks, database delays, or layout shifts, then decide whether each one is necessary. Replace an inefficient plugin only when a lighter option meets the same requirement, and test changes on a staging site. Deactivating essential functionality without diagnosis can create larger problems than it solves.
Which metric should I fix first: LCP, INP, or CLS?
Start with any metric classified as Poor, then prioritize the issue affecting the largest important URL group or the most valuable user journey. If several metrics are poor, begin with fixes that help more than one metric, such as reducing heavy JavaScript or simplifying the page template. Re-test after each release so you can connect improvements or regressions to a specific change.
Conclusion
Core Web Vitals provide a practical framework for finding three costly experience problems: slow main content, delayed interactions, and unstable layouts. Start with field data, diagnose representative pages in lab tools, fix the underlying template or resource, and then allow new real-user data to confirm the result.
The strongest Core Web Vitals strategy does not chase a perfect number. It makes important pages reliably fast, responsive, and stable across the devices people actually use. Combine that work with helpful content and sound technical foundations, and both visitors and search engines receive a site that is easier to use and understand.