AI keyword analysis can appear complete while relying on an incomplete Search Console export. Rare search queries may be omitted for privacy, and the report does not display unlimited rows. Before clustering keywords or summarizing opportunities, calculate how much of the chart’s click total is represented by the query rows you can actually inspect. The result is a reproducible coverage check, not a guess about hidden keywords.
Quick Answer
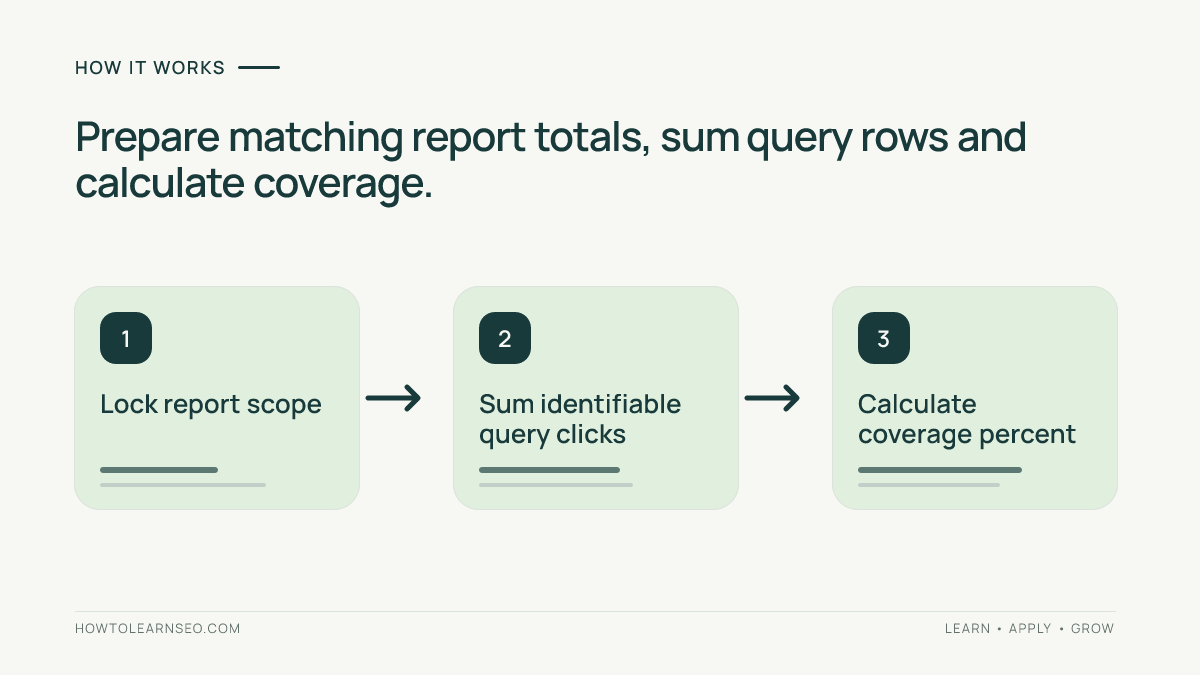
In Search Console Performance, select a completed date range, one property and one Search type. Copy the unfiltered chart’s clicks. Export the Queries table with the same settings and sum its click column. Divide the listed clicks by the chart total. Record the percentage, unrepresented click difference, report filters and limitations before using AI to interpret the export. Never infer the number or wording of anonymized queries from the difference.
Key Takeaways
- Queries absent from a table are not necessarily missing from Google’s chart total.
- Matching report scope matters more than a sophisticated spreadsheet formula.
- Coverage describes visible query clicks, not unique keyword completeness.
- AI conclusions must disclose that the analyzed rows can be incomplete.
Prepare a Like-for-Like Report
The practical reader here is an analyst preparing identifiable queries for editorial planning, not someone trying to reverse-engineer private searches. You need access to a verified Search Console property and a spreadsheet. Your tangible output will be a small evidence sheet containing chart clicks, exported query clicks, a ratio, an exception note and a decision about permissible conclusions.
Open the Search results Performance report and select a date range containing completed days. Record the property, Search type, country, device, dates, search appearance and any page or query filters. Begin with an unfiltered property-level view. Google’s Performance troubleshooting documentation explains that filtering, aggregation, privacy and row limits may change chart-table comparisons. A page-filtered view needs its own matched control.
Copy chart clicks into a worksheet. Export the Queries table without changing the selections. Keep that raw file in a protected tab. The Search Console guide explains the report’s core metrics for readers new to the interface. Do not compare the Queries export from Web search with a chart from Discover or Image search.
Calculate a Query Coverage Indicator
Create a sheet called Coverage and paste query rows into another called Data. Suppose the Data tab contains query clicks in column D, starting at row 2. Put the chart total in B2 of Coverage and enter the following formulas:
- B3:
=SUM(Data!D2:D)for the exported query clicks. - B4:
=IFERROR(B3/B2,"")formatted as a percentage. - B5:
=B2-B3for clicks not represented by the rows.
Clicks are the common unit. Averaged CTR or position values cannot replace either total in the coverage calculation. Confirm that CSV values are numeric and that you have not appended multiple copies of the same export. Keep the raw input and formulas available for a second reviewer, rather than storing only a screenshot of the outcome.
Worked Example: Measure the Difference Without Inventing Queries
Consider an illustrative website whose unfiltered monthly Web report shows 2,400 clicks. Its exported query rows total 1,980 clicks. The ratio is 1,980 divided by 2,400, or 82.5 percent. The difference is 420 clicks. These numbers are instructional, not observations from this site’s Search Console account.
| Cell | Example value | Explanation |
|---|---|---|
| B2 | 2,400 | Chart click total |
| B3 | 1,980 | Listed query clicks |
| B4 | 82.5% | 1,980 / 2,400 |
| B5 | 420 | Unrepresented click difference |
The valid finding is that displayed query rows account for 82.5 percent of the chart’s clicks under those settings. Do not report that “420 clicks came from 420 secret keywords.” Row limits and privacy suppression are different mechanisms, and no calculation exposes missing query text. The result describes the available dataset, not total keyword diversity or a site’s SEO quality.
Edge case: if chart clicks equal zero, the IFERROR formula leaves coverage blank, because dividing by zero is undefined. If query-row clicks exceed chart clicks, stop and check whether duplicated rows, filters or differing aggregation created an invalid comparison. Do not silently force a negative difference to zero.
Explain Why the Rows May Be Incomplete
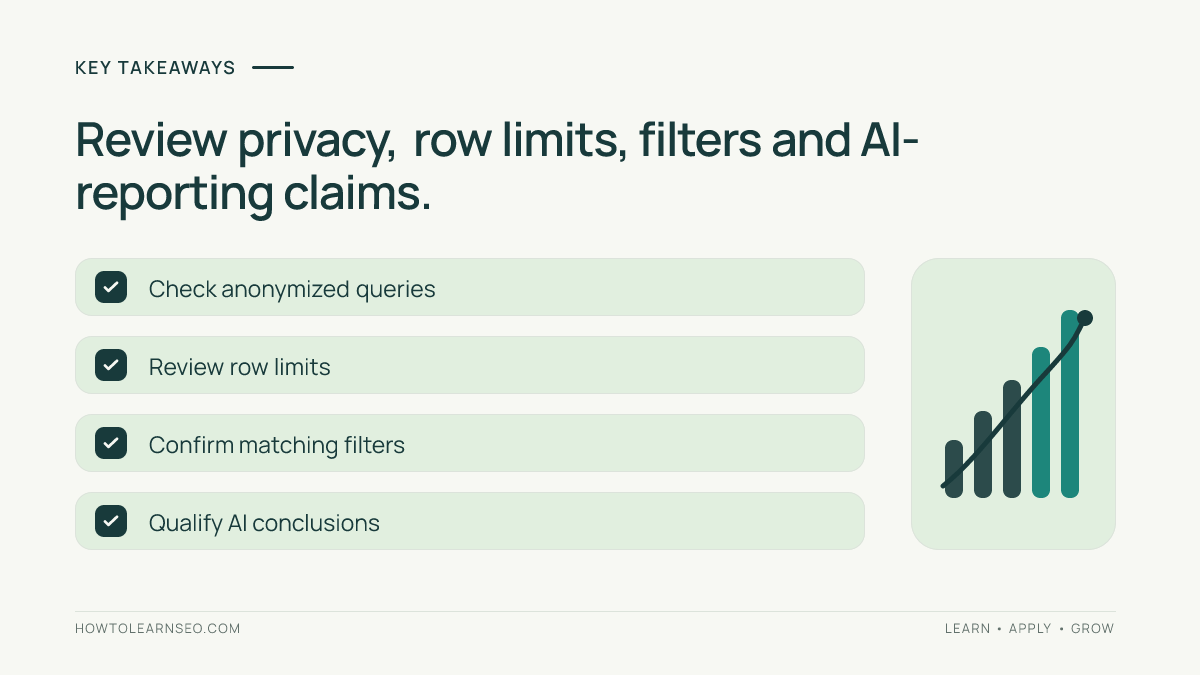
Google’s privacy and reporting limits explanation notes that anonymized queries are omitted from query tables while they can contribute to unfiltered chart totals. The interface has a limited number of visible table rows. Those two effects can coexist; the worksheet does not isolate how much each contributes.
The Search Analytics API can return up to 25,000 rows per request and offers pagination, but Google warns that it does not guarantee every data row. It cannot reveal queries hidden for privacy. API exports grouped by both page and query may also have different aggregation from a property chart, so store request dimensions before comparing anything.
If an analyst applies a query filter to isolate a topic, a fresh baseline is required. Comparing that new filtered table with an old unfiltered chart would mix two questions. Document whether a ratio refers to all visible property queries, visible mobile queries or another explicitly defined slice.
Set Honest Boundaries for AI Keyword Analysis
For grouping the identifiable terms, an incomplete export can still be useful. Ask the assistant to preserve the supplied rows, classify only those terms and flag uncertain intent. The keyword clustering in Google Sheets guide shows how to maintain a source-of-truth table. State that results describe visible queries rather than all searches.
Do not use the ratio to estimate traffic from ChatGPT, count AI citations or claim exact shares of total query demand by topic. Those questions require other evidence. Before sharing a file with an external model, apply the organization’s information policy and the Search Console export sanitization process. Query privacy filtering is not permission to disclose the remaining data.
Verify and Record the Decision
Check the raw export’s click sum against B3, confirm matching report filters and inspect the report date range. A reviewer should be able to reproduce every number from the saved inputs. If the numbers disagree, stop the AI report and correct the scope or import instead of modifying the denominator to improve coverage.
Next review the model’s language. Replace “all queries were analyzed” with “available query rows were analyzed.” Use the SEO report audit workflow to verify each resulting claim. Google’s Search Console API data guidance explains further collection limits. Repeat the same procedure on later completed periods to track whether coverage changes.
Frequently Asked Questions
Why do query clicks differ from Search Console chart clicks?
Rare anonymized queries may be excluded from the query rows while still contributing to an unfiltered chart total. The table also has row limits. Report filters and aggregation can produce further differences. Check the report scope before interpreting the gap as a missing-data problem.
Can the click difference tell me how many queries are hidden?
No. The difference counts clicks, not distinct query strings. A query may generate several clicks, and Google does not reveal the suppressed text. Use the difference to qualify coverage of the rows, not to infer the identity or number of hidden keyword phrases.
Will the Search Analytics API return every keyword?
No. It offers greater row retrieval capacity than the interface, including pagination, but Google limits the underlying dataset. Anonymized query text remains inaccessible. Record the API dimensions, date range and offsets so the resulting analysis is reproducible.
Should I abandon AI keyword clustering when coverage is low?
Not necessarily. Organizing visible queries may still help create a useful editorial backlog. Disclose the coverage result and prohibit claims about the exact distribution of all search terms. If the decision needs a complete census, do not present the incomplete export as sufficient.
What should I do if query-row clicks exceed chart clicks?
Look for duplicated CSV rows, different filters or mismatched aggregation. Rebuild the comparison from one property and one completed date range. Never delete rows simply to make the formula look reasonable; the unexpected result is a diagnostic signal that the worksheet needs correction.
Conclusion
AI can organize a query export but cannot restore evidence that Search Console never supplied. Lock the report scope, calculate the visible-row coverage, investigate exceptions and carry the limitation into every summary. That gives readers a useful quality check rather than unwarranted confidence in a partial dataset.